

Zambian 2013 Budget Reviewed by Kampamba Shula
On 12 October 2012, the Minister of Finance, Hon. Alexander Bwalya Chikwanda, MP, announced the 2013 National Budget. Budget highlights and taxation and other changes as contained in the Budget speech and the Zambia Revenue Authority (“ZRA”) publication.

INDECO (IDC): Past Problems and Opportunities Analysed by Kampamba Shula
INDECO (IDC): Past Problems and Opportunities Analysed

Critical Review of IMF 2013 Zambia ARTICLE IV CONSULTATION report by Kampamba Shula
Debt management is still on track The agreed norm is that for internal borrowing the threshold is 25 per cent of GDP but our debt stands at K17 billion, which is 15 per cent of GDP and for external borrowing, the threshold is 40 per cent and our debt is US$3.1 billion which is 14 per cent of GDP, so we are far below the agreed norms. So even in the long term , Zambia is still on track.

US Economy 2014 First Quarter Analysis and Outlook by Kampamba Shula
New data shows the U.S. economy contracted in the first quarter of this year, keeping pace with shifting expectations but down sharply from the prior already disappointing estimate.

Zambia Debt Analysis
Some might say that Zambia should not borrow externally and even as sincere as they may be they are wrong. When the Government borrows locally “Crowing out” happens.
Showing posts with label Zambian debt. Show all posts
Showing posts with label Zambian debt. Show all posts
Friday, June 26, 2020
Monday, October 13, 2014
2015 Budget Review and Analysis by Kampamba Shula

2015 Budget
1.1. Economic developments in 2014
• Current estimates are that the Zambia economy will create 120,000 new formal sector jobs mostly from the private sector.
• Preliminary projections are that real GDP growth will be higher than the projected 6.5 percent for this year. This will be mainly driven by a good harvest in the 2013/2014 farming season, increased electricity generation, investments in private and public infrastructure and growth in manufacturing as well as in transport and communications.
• The Treasury took measures to consolidate the fiscal position. These measures included actions to contain the size of the public sector wage bill and streamlining of expenditure towards priority programmes. As a consequence, the end year budget deficit is expected to be within the programmed level of 5.5 percent of GDP compared to 6.5 percent in 2013.
• Inflation was contained within single digits over the first nine months and was 7.8 percent in September 2014 from 7.1 percent in December 2013. The slight increase was due to the depreciation of the Kwacha, mainly in the first half of the year, and the pass-through from upward adjustments in fuel prices and electricity tariffs.
• The first half of 2014 experienced a rapid depreciation of the Kwacha against major currencies, reaching a high of K7 per US dollar in May. This partly arose from a reduction in the supply of foreign exchange to the market, particularly from the mining sector, and subsequent speculative behaviour. In response, the Bank of Zambia tightened monetary policy through a number of measures, including adjusting upwards the policy rate, increasing the statutory reserve requirement and extending its application to Government and Vostro accounts.
• The tight liquidity conditions came at the cost of a temporary rise in interest rates which constrained access to credit. Having achieved relative stability in the foreign exchange market, the Bank of Zambia has, since July 2014, eased liquidity conditions. As a result, the daily average overnight interbank rate reduced to 12.8 percent as at end-September 2014 from 25 percent at end-June 2014.
• During 2014, trading activity on the Lusaka Stock Exchange (LuSE) increased, reflecting improved investor sentiment and participation on the local bourse. Market capitalisation increased by 8 percent to K62.9 billion while the All-Share index rose by 17 percent to 6,620.9 by end-September 2014.
• To comply with the LuSE listing requirements, Government will itself reduce its shareholding in ZCCM Investments Holding Plc to 60 percent from 87 percent.

• The overall Balance of Payments is expected to register a surplus of US $486.0 million in 2014 compared to a deficit of US $344.9 million in 2013. This surplus is attributed to improvements in both the current and financial accounts. Higher copper export volumes and the receipt of Eurobond proceeds account for the expected improvements.
• Consistent with improvement in the overall Balance of Payments position, gross international reserves are projected to increase to US $3.2 billion at end-December 2014, representing 3.6 months of import cover, from US $2.7 billion or 3.0 months of import cover recorded at end-December 2013.
• The stock of Government’s external debt as at end-September 2014 was US $4.7 billion. This represents an increase of 34 percent from US $3.5 billion as at end 2013. The increase in the external debt stock was mainly on account of the US $1 billion Eurobond that was issued in April as part of programmed financing in the 2014 budget. The total external debt service for the first nine months of 2014 amounted to US $126.2 million which is less than 3 percent of the domestic revenues.
• Zambia’s domestic debt including arrears as at end-September 2014 stood at K21.9 billion representing an increase of 5.6 percent from K19.7 billion as at end-December 2013. The increase was largely on account of programmed financing for the 2014 Budget.
1.2. Macroeconomic Objectives, Policies and Strategies for 2015
The Government in 2015 will continue to focus on industrialisation together with job and wealth creation, so as to reduce poverty and inequality on a sustainable basis. This will be achieved by investing in sectors that have been identified to best promote employment for our youthful population, significantly increase productivity in the economy by empowering our workers with the requisite skills for the 21st century, contribute to higher and inclusive economic growth, and develop the rural areas to narrow the urban-rural divide. These include the agriculture, tourism, manufacturing and construction sectors.
The specific broad socio-economic policy objectives for 2015 will be to:
(a) Achieve a real GDP growth rate of above 7.0 percent;
(b) Achieve an end year inflation rate of no more than 7.0 percent;
(c) Increase international reserves to at least 4.0 months of import cover;
(d) Raise domestic revenue collections to at least 18.5 percent of GDP;
(e) Contain domestic borrowing to no more than 2.0 percent of GDP;
(f) Accelerate the diversification of the economy, and continue the drive to create decent jobs, especially for the youth; and
(g) Accelerate implementation of interventions in the health, education and water and sanitation sectors.
1.3. 2015 Budget

In 2015, Government proposes to spend K46.7 billion or 24.6 percent of GDP. This will be financed from domestic revenues of K35.1 billion which is 75.2 percent of the total Budget and 18.5 percent of GDP. Grants from cooperating partners of K1.2 billion or 2.6 percent of the total budget will complement domestic revenues. Domestic borrowing is projected to be 2.0 percent of GDP translating to K3.8 billion while K4.2 billion is a combination of foreign programme and project financing. The balance of K2.4 billion is earmarked proceeds from the 2014 Eurobond.
1.3.1. 2015 Expenditure Allocations by Function

1.3.1.1. General Public Services
• K12.0 billion or 25.8 percent of the budget has been allocated for General Public Services. To ensure that Government meets both its domestic and external debt obligations, K2.9 billion and K2.4 billion have been provided respectively. Other notable expenditure allocations under this category include K669.4 million for grants to Local Authorities of which K586.8 million is for the Local Government Equalisation Fund.

• To ensure the continuation of infrastructure development in the newly created provinces and districts, K500 million has been provided in 2015. Further K210 million has been allocated for the Constituency Development Fund.
• The constitution making process has continued keenly and in earnest, as the Government discusses the matter with all interest groups it has allocated K29.3 million towards this process.
1.3.1.2. Economic Affairs
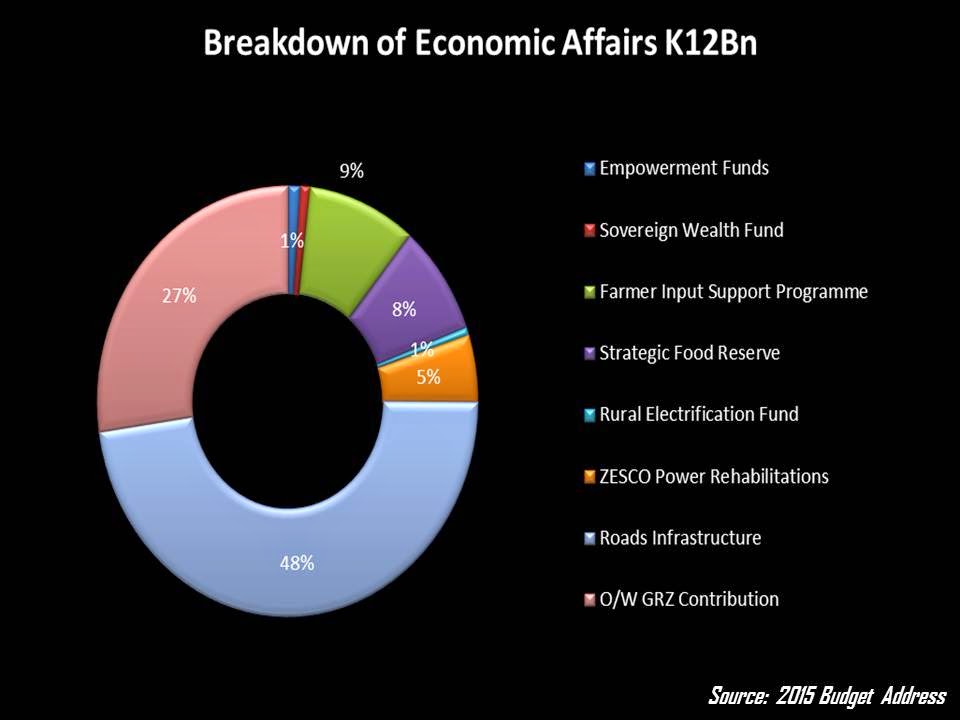
• Government proposes to spend K12.7 billion or 27.3 percent of the total budget to support the economic sectors and lays the basis for further prosperity for our people. In this regard, an allocation of K5.6 billion has been set aside for road infrastructure, including the Link Zambia 8000 and the Pave Zambia 2000 projects.
• Diversification from maize remains paramount in attaining more inclusive growth and economic independence. In this regard, K254.9 million has been allocated towards the E-Voucher System which will allow farmers more flexibility of choice in the inputs they receive. A further, K1.1 billion has been allocated to the Farmer Input Support Programme (FISP). In 2015, it is expected that 1,000,000 farmers will access inputs through the E-Voucher and FISP programmes.
• Government will continue promoting private sector participation in grain marketing by limiting grain purchases by the Food Reserve Agency to the 500,000 metric tonnes required for the strategic food reserve. In this regard, Government has provided K992.9 million for strategic food reserves.
• To promote irrigated agriculture and increased access to water resources, Government has allocated K164.5 million towards the construction and rehabilitation of dams to achieve our target of an additional 17,500 hectares under irrigation by 2016.
• To promote livestock and fisheries, Government has allocated K307 million for livestock disease control measures and aquaculture development.
• To address the challenges posed by the ever growing demand for electricity, Government has provided K600 million to ZESCO for power generation, transmission and distribution. A further K70.7 million has been allocated to increase the number of rural communities across the country connected to the national grid under the Rural Electrification Programme.
• To continue nurturing the entrepreneurial spirit Government has allocated K123.7 million to various empowerment funds that cater for the youth, women and SMEs
• Government has allocated K100 million for the establishment of a sovereign wealth fund. Going forward, a significant propotion of the dividends from state-owned enterprises that will fall under the Industrial Development Corporation will form part of the fund.
1.3.1.3. Education and Skills Development
Government proposes to spend K9.4 billion or 20.2 percent of the total budget in the education sector. In an effort to reduce the pupil teacher ratio, 68 percent of this amount will go towards the recruitment of 5,000 teachers and sustaining the current establishment. Government has also provided K1.1 billion for infrastructure development for early childhood, primary and secondary education.
K650 million has been allocated to commence construction of additional student accommodation at the University of Zambia, Copperbelt University, Mulungushi University and Evelyn Hone College, and to continue the construction of new universities. The new Universities that are earmarked for completion in 2015 are Paul Mushindo, Chalimbana and Palabana.
Government will embark on the construction of King Lewanika and Luapula Universities in 2015.Robert Kapasa Makasa, Mukuba and Kwame Nkrumah Universities are almost completed.
A further K79.6 million has been allocated towards the construction of nine trades training institutes across the country of which three will be completed in 2015 in Isoka, Kalabo and Mwense. In addition, K28.5 million has been allocated towards the procurement of research and development equipment as well as the commencement of the construction of a National Science Centre in Chongwe, a Fisheries Centre in Samfya and a Mineral Research Centre in Solwezi.
To address the challenges facing our vulnerable school leavers to access tertiary education at our colleges and universities, Government has raised the allocation to bursaries by 27.9 percent to K200.2 million from the 2014 allocation of K156.5 million. The cost of publicly provided tertiary education per student is among the highest in the SADC region.
1.3.1.4. Health
In line with Government’s objective of providing equitable access to quality health care, Government has allocated K4.5 billion or 9.6 percent of the overall budget in 2015 to the Health Sector. Of this allocation, K268.2 million has been allocated for the construction and rehabilitation of health infrastructure in various parts of the country.
An allocation of K753.5 million has been set aside for the procurement of essential drugs and medical supplies. K52.5 million has been allocated for the net recruitment of over 2,000 health personnel.
1.3.1.5. Housing and Community Amenities
Government has allocated K798.7 million for housing and community amenities, of which K541 million will be for the rehabilitation and construction of water supply and sanitation infrastructure in the rural, peri-urban and urban areas.
1.3.1.6. Public Order and Safety
K2.2 billion has been allocated to maintain public order and safety. Key interventions will involve modernisation of our security wings; recruitment of security personnel including immigration and prison officers; rehabilitation of prison infrastructure; and construction and rehabilitation of staff houses.
1.3.1.7. Social Protection
Government has provided K1.3 billion for social protection of which K805 million is for the Public Service Pension Fund, K180.6 million for the social cash transfer scheme and K50 million for the food security pack. The allocation to social protection translates to 2.7 percent of the overall expenditure in 2015.
1.3.1.8. Other functions
K3.7 billion has been allocated to the remaining functions of Defence, Environmental Protection and Recreation, Culture and Religion. Of this amount, K3.2 billion is for Defence.
1.3.2. Revenue Estimates and Financing
The proposed revenue measures have been framed in the context of Government’s aim to consolidate its fiscal position and make the tax system simpler and more effective. This entails, inter alia, accelerating the modernisation of tax administration and restructuring the current mining tax regime in order to capture more resources to address public expenditure needs.
1.3.2.1. Revenue Measures

• Government proposes to double the presumptive tax payable by these operators. This measure will raise additional revenue of K3.8 million.
• Government proposes to increase the specific duty rate on refined edible oil to K2.20 per kilogram from 85 Ngwee per kilogram in order to bring it at par with the ad valorem rate of 25 percent charged on imported refined edible oil
• In order to stimulate the local manufacturing industry and sustain employment in the sector, Government proposes to increase customs duty on explosives to 25 percent and on roofing sheets to 30 percent.
• Government proposes to increase excise duty on imported un-denatured spirits of alcoholic content of 80 percent or higher by volume to 125 percent from 0 percent. This proposed measure will only apply to importers who are not licensed to manufacture excisable products while the licensed manufacturers will continue to account for excise duty at the point of sale of the manufactured potable spirits at the current excise duty rate of 60 percent.
• Government proposes to remove the 5 percent customs duty on aviation fuel in order to reduce costs in the aviation industry. As a result of this measure Government will forego K6.3 million in revenue.
1.4. Changes to the Mining Fiscal Regime
Government and the mining companies, Government proposes to redesign the mining fiscal regime by replacing the current two tier system with the following simplified mining tax structure:
a) 8 percent mineral royalty for underground mining operations as a final tax;
b) 20 percent mineral royalty for open cast mining operations as a final tax;
c) 30 percent corporate income tax rate on income earned from tolling; and
d) 30 percent corporate income tax rate on income earned from processing of purchased mineral ores, concentrates and any other semi-processed minerals, currently taxed as income from mining operations.
The proposed changes to the mining tax regime will not apply to mining of industrial minerals. The expected additional revenues, in 2015, as a result of these new measures are estimated at K1.7 billion.
Analysis
The 2015 Budget is in line with the Medium term expenditure framework (2015-2017). The contentious issue arising from this budget is most prominently the Wage Freeze. In September 2013 the Zambian Government approved a harmonious increase of wages for civil servants. The increase was as much as 100% for some civil servants. The wage increase was much anticipated but its size was larger than predicted. To balance this out the Government introduced a wage freeze on the salaries of civil servants for 2 years.There have been calls from people in the media and others to drop the wage freeze.In truth and in free market legality the Government was not supposed to impose a wage freeze. But a closer look at the fiscal position indicates that Government cannot actually afford to drop the wage freeze right now after the unilateral increase in 2013. Unions will continue to fight the wage and they should (its their job) but the wage freeze might only be dropped in 2016.
The mining fiscal regime change is a bold move towards royalty taxes and its success will hinge on the Zambian Governments ability to actually monitor and evaluate the effectiveness of the new tax system.
Debt levels of $4.7 billion and K21.9 billion for external and domestic debt remain within international standard thresholds. This however should not undermine the need for greater fiscal management.
In terms of Allocations, a bulk of the economic affairs, similar to last year is still going to the Roads sector. The introduction of the Local Government Equalisation Fund.will be interesting to see how it pans out.
It is motivating to see that the constitution process has been budgeted for, what is intriguing is to what level of the process will these funds move the draft constitution.
The doubling of presumptive tax on public service vehicles is reasonable and will help reduced "free riding". Other import duties on edible oils and roofing sheets will go a long way to help the local manufacturing companies.The removing of 5 percent customs duty on aviation fuel will also help improve the profitability of the aviation industry which should translate into better tourism packages and numbers of visitors.
The 2015 Budget did not address the 2014 inflation targets which according to our current trajectory Zambia will not be able to meet.In the 2014 Budget Zambia estimated and inflation rate of 6.5%, Inflation now stands at 7.8%.This is the reason even the 2015 inflation projections were revised upwards to 7%. Growth will be much in line with projections for 2014 and 2015 driven by the Governments ambitious infrastructure programme, Agriculture, manufacturing, transport and communications.
Click the link below to download the full analysis
2015_Zambia_Budget_Analysis
Thursday, July 17, 2014
Zambia 2014 First Half Economic Review: H1 2014 by Kampamba Shula

Zambia 2014 First Half Economic Review: H1 2014
This is the first ever edition in the series which highlights the performance of the Zambian Economy in the first half of 2014.
Growth

Industrial Performance: Whole sale and retail grew by 31% while real estate and construction grew by 9.5% and 9.1% respectively
• The Whole sale and retail was the best performing sector in the first quarter growing by 31%.
• The real estate sector was the second best performing sector growing by 9.5%
• Construction was the third best performer growing at 9.1%
• Other sector performance
• Financial services growth of 2%
• Transport sector growth of 2%
• Energy sector was the worst performer contracting by 23%
• Manufacturing contraction by 14%
• Mining contraction by 2%
Agriculture

In terms of the National Food Balance Sheet for the 2014/2015 agricultural marketing season, the country has a significant maize surplus above the national maize requirement. Other crops expected to register an increase include rice, tobacco, millet, and groundnuts.
• The stock of maize held by the Food Reserve Agency (FRA) declined to 349,120.3 mt as at end-May 2014 from 644,682.4 mt at end-December 2013.
• Similarly, the stock of rice held fell to 1,560.0 mt from 1,948.5 mt during the same period. The decline in stocks is typical during the lean period, which runs from October to May. However, with the crop marketing season commencing soon, the stock of maize is likely to increase significantly.
• According to the Crop Forecast Survey results for 2013/2014 the country is expected to produce 3,350,671 mt of maize, 32.3% higher than 2,532,800 mt produced during the 2012/2013 agricultural season.
Construction

The pledge of US$3.3 billion is mainly in the construction sector which accounted for US$3 billion
Construction was the third best performer growing at 9.1%
Mining

China has began to revaluate its use of copper as collateral for loans. This coupled with lower manufacturing sentiment has contracted demand for commodities like copper.
• Mining sector contracted by 2% in Q1 but rebounded slightly in the second quarter
• Copper prices fell by 7% in Q1
• Weaker demand constrained supply of the usual foreign exchange reserves from the Mining sector
MOPANI Copper Mines in Mufulira has increased copper production by 2,500 tonnes in the first quarter of 2014 highlighting a growth rate of 10 per cent
First Quantum Minerals (FQM), the owner of Kansanshi copper mine in Solwezi, recorded a 43 per cent rise in copper production during the first quarter ended March 31 2014.
The increase is due to sound management of the factors under the mines control and benefits from the investments in process improvements.
Copper prices have trended down since reaching an all-time high in early 2011 and fell by more than 10% during the first quarter of 2014 (mainly in March), owing to market concerns about the Chinese economy, and linked to this the ability of Chinese firms to continue to use copper as collateral in trade financing which has supported higher global prices
Copper output rose to 473,249 mt during the period January to May 2014, compared to 399,515 mt produced during the same period last year. However, cobalt production was lower at 1,951 mt when compared with 2,709 mt produced during the corresponding period in 2013.
Energy
Fuel prices rose in Q1 by 7.22% for petrol, 8.75% for diesel and 9.54% for kerosene on the back of foreign exchange rate losses on the oil import bill.

In the energy sector, total electricity generation during the period January 2014 to May 2014, increased to 5,731,907 Mwh from 5,467,181 Mwh during the corresponding period in 2013. This reflects the investments made in power generation in order to raise power supply required to meet the high demand arising from increased economic activity in the country.
Inflation
Inflation has been on an upward trend since the beginning of the year with annual inflation rising to 7.9% in June from 7.1% in December 2013

Factors contributing to these inflationary pressures include
• The seasonal supply factor (lean pre-harvest period October-May), removal of Government subsidy on maize,
• Pass-through effects of the depreciation in the exchange rate, higher fuel prices
• Increase in excise duty on cigarettes and alcoholic beverages
Foreign Exchange Market

The exchange rate of the Kwacha against the US dollar has exhibited a depreciation trend since the beginning of the year. As at 11th June 2014, the Kwacha had depreciated by 14.9% against the US dollar to trade at K6.3348/US$ compared to K5.5126 per US dollar at the close of December 2013. This was mainly due to intra-day mismatches between supply and demand for foreign exchange in the domestic market on account of the following:
• A reduction in the supply of dollars to the market, particularly from the mining sector which accounts for the bulk of foreign exchange supply.
• The decline in copper price by 9.1% to US$ 6,691.00 per tonne as at 11th June 2014 from US$7,360.00 per tonne at the end of December 2013, which impacted on market sentiment.
• Deterioration in the current account balance to a deficit of US $260.7 million during the first quarter of 2014, from a surplus of US $28.7 million in the fourth quarter of 2013, mainly on account of stronger imports relative to exports and higher service payments.
• A significant build-up of liquidity over the fourth quarter of 2013 into the first quarter of 2014 (after civil service wage increase) and expanding informal trade sector which supported demand for foreign exchange.
• The strengthening of the dollar on the international financial markets has also impacted on the Kwacha, leading to a corresponding weakness in then Kwacha through financial flows.
Government and Private Investments

During the first quarter of 2014, the Treasury released K1 Billion for Investments and Special Projects
• K245 Million was released to the National Road Fund Agency
• K140 Million was targeted at remodelling works at the Kenneth Kaunda International Airport
• K35 Million for ZESCO rehabilitation works
Other Investments included
• K15 Million for recapitalization of the Government Printing Department
• K6.8 Million as GRZ support to the Millennium Challenge Account Compact.
• K6.4 Million was released for the Youth Skills Development Programme
Government Spending

Ministry of Finance released K168 Million grants to various institutions of government to facilitate their operations and efficient programme implementation in Q1
The Treasury has also released K84 Million for road maintenance, rehabilitation, and construction. K20.7 Million was released to the Ministry of Local Government and Housing for water and sanitation programs.
A further K166 Million was released for salaries for civil servants in various government institutions, compensation and awards, and for emoluments for personnel in Zambia’s Missions Abroad.
Foreign Direct Investments

Zambia recorded US$3.3 billion in foreign direct investment (FDI) pledges in the first quarter ended 31st March, 2014.
China recently emerged as Zambia's biggest source for FDI with inflows estimated at about US $1 billion, mostly into mining, manufacturing and construction sectors.
• Pledges reflect an increase in foreign direct investment in 2014 as compared to 2013 during the same period which recorded pledges of US$2.3 billion
• US$3.3 billion is mainly in the construction sector which accounted for US$3 billion, with the manufacturing sector accounting for US$132 million while other sectors contributed the rest of the FDI.
• The increase in FDI in the first quarter of 2014 as compared to the same period in 2013 further explains that regardless of how the economy is performing, increase in FDI is dependent on what the investor is looking for in terms of resources, market and the expected returns.
• Projection for the second quarter, the month of April has already recorded US$98 million in FDI pledges with pledged employment of one thousand forty five jobs from 25 projects.
Monetary and Fiscal Policy

During the period January to May 2014 monetary policy remained focused on achieving the end-year inflation target of 6.5%. In line with this objective, the Bank of Zambia (BoZ) tightened monetary policy by raising the policy rate from 9.75% in January 2014 to 10.25% in March, and then 12.0% in April 2014. The statutory reserve requirement was also increased by 600 basis points to 14% with effect from 10th March 2014. Following persistent volatility in the exchange rate, the Bank of Zambia took further measures to tighten liquidity in the banking system by extending the application of statutory reserves to government deposits and vostro accounts, as well as tightening the maintenance regime for statutory reserves.
Money market liquidity, as measured by commercial banks current account position, decreased by 46.8% to K593.6 million at end-March 20145 from K1,115.7 million at end-December 2013.
This was mainly on account of
• Net statutory reserve withdrawals
• Net Government securities sales
• Net sales of foreign exchange
Weighted lending rates
 Commercial banks’ nominal interest rates recorded a mixed performance during the review period. The average lending rate rose to 18.1% in May 2014 from 16.4% in December 2013, following the rise in the BoZ policy rate. However, the 30-day deposit rate for amounts exceeding K20,000.00 and the average savings rate for amounts above K100.00 was little changed at 5.4% and 3.5% from 5.3% and 3.6%, respectively in December 2013.
Yield rates on Government securities have however trended upwards, largely reflecting higher Government domestic borrowing. The weighted average composite yield rate for Treasury bills closed 410 basis points higher at 19.4% in June 2014 from 15.3% in December 2013, while the weighted average bond yield rate gained 180 basis points to close at 18.1% from 16.3%.
In terms of the outstanding stock of Government securities, Government Treasury bill marginally declined to K9,881.2 million in June from K9,942.9 million in December 2013, while the stock of Government bonds rose to K10,576.8 million from K9,429.1 million in December 2013. Commercial banks remained the largest investors in Treasury bills with holdings of K6,160.9 million at face value, representing 62.4% of the total bills in circulation as at end June. The non-bank public accounted for 26.9% while the Bank of Zambia holdings stood at 10.8%. In the Bond market, the non-bank public were the largest holders at 53.0% (K5,601.7 million), while commercial banks accounted for holdings of 30.0% or K3,167.4 million. The Bank of Zambia held 17.1% or K1,807.6 million.
Fiscal Policy: Debt Management

For the period from January, 2014, total external debt service (principal plus interest payments) now stands at USD 52.2 Million of which USD 2.6 Million is a payment made in April, 2014. According to Ministry of Finance projections, the total external debt falling due over the next 12 months stands at USD 249 Million or 1.3% of GDP.
For the period from January, 2014, total domestic debt service related to Government securities (principal plus interest payments) now stands at K3.2 Billion of which K544.6 Million is a payment made in April, 2014. In the same month, Government issued K458 Million Treasury Bills in the domestic market. According to Ministry of Finance projections, the total domestic debt falling due over the next 12 months stands at K9.8 Billion or 8% of GDP.
External Sector Developments
Preliminary data shows that Zambia’s international trade performance during the first five months of 2014 was unfavourable. The merchandise trade surplus narrowed by 16.1% to US $271.1 million from US $323.7 million recorded over the corresponding period in 2013. This was largely attributed to a higher decline in merchandise export earnings relative to the merchandise imports bill.

Merchandise export earnings declined by 5.0% to US $4,264.3 million from US $4,488.9 million realized the same period in 2013, explained by a decline in non-traditional exports and cobalt earnings.
During the first five months of 2014, Non-traditional export earnings, at US $1,009.5 million were 30.0% lower than US $1,441.9 million registered during the corresponding period last year. This was largely on account of lower earnings from the export of copper wire, burley tobacco, cotton lint, fresh flowers, fresh fruits and vegetables, gemstones, cement and lime, and maize.
Similarly, cobalt export earnings declined by 23.2% to US $45.7 million from US $59.5 million recorded during the corresponding period in 2013, largely on account of a 37.0% decline in export volumes to 1,725.6 mt from 2,740.1 mt registered the previous year. The realized monthly average price of cobalt, however, increased by 22.0% to US $26,491.91 per ton from US $21,709.42 per ton registered during the same period in 2013.
However, copper export earnings grew by 7.4% to US $3,209.1 million during the first five months of the year from US $2,987.5 million recorded over the same period last year, driven by higher export volumes. Copper export volumes, at 477.485.3 metric tons (mt), were 19.4% higher than 399,919.8 mt recorded during the corresponding period in 2013. The average realized price of copper, however, declined by 10.0% to US $6,720.86 per ton from US $7,471.77 registered during the same period last year.
Meanwhile, the year-to-date (May 2014) merchandise imports bill declined by 4.1% to US $3,992.6 million from US $4,165.2 million registered in 2013. This was due to lower import bills of commodity groups such as industrial boilers and equipment, motor vehicles, chemicals, plastic and rubber products, and paper and paper products.
There was a decrease in the total value of metal exports from K 3,631 Million in January to K 3,458 Million in March 2014.
The overall contribution of metals and their products to the total export earnings averaged 75 percent.
The share of Non Traditional Exports recorded an average of 25 percent in revenue earnings between February and January 2014.
Gross International Reserves
Gross International Reserves (GIR) rose to US $3,387.13 million as at end-May 2014 from US $2,683.8 million at end-December 2013, largely due to the receipt of the second Euro bond proceeds. The level of reserves in May 2014 represents about 3.5 months of import cover as opposed to 3.0 months of import cover in December 2013.
Banking Sector
The banking sector financial performance and condition continued to be satisfactory and stable. As at 31 May 2014, the banking sector was adequately capitalized, with the aggregate capital adequacy ratios at 21.7% and 23.8%, which were well above the minimum requirements of 5.0% and 10.0% for the primary and total regulatory capital, respectively. In addition, the sector continued to post strong earnings
Projections for Third quarter 2014 and Rest of the year
Inflation is expected to edge downwards by the end of the third quarter of 2014. This projection is premised on expected improvement in the supply of various food stuffs as well as the lagged effects of the kwacha strengthening following monetary policy tightening in recent months. However, upside risks include cost push factors emanating from the recent increase in fuel prices and electricity tariffs.
The Bank of Zambia projects an annual growth rate of 6.5% of rebased GDP. We estimate a growth rate slightly higher at 6.8% of rebased GDP on the premise of a rebound in the third quarter driven by the mining sector, construction (especially railways and roads),energy, Agriculture and tourism driven by the 50th Jubilee independence celebrations.
Disclaimer: All speculation given in this article is plausibly deniable.
You can download this report at the link below
Click here to view and download on academia
Friday, January 31, 2014
Auditor General’s Report Analysis by Kampamba Shula

Auditor General’s Report Analysis
Intro
During the year 2013, the Office carried out one hundred and
thirty eight (138) audits on the accounts for the financial year ended 31st
December 2012. This is an analysis of relevant sections.
The major issues that have been highlighted across all the heads
of expenditure and revenue collected are as shown in the table below.
Issue
|
2012
|
2011
|
2010
|
Unaccounted for Revenue
|
1,860,280,055
|
2,253,941,307
|
1,761,709,547
|
Unaccounted for Funds
|
3,624,275,679
|
5,054,209,802
|
3,823,553,675
|
Misapplication of Funds
|
38,738,763,261
|
23,685,562,199
|
220,628,818,731
|
Unretired Imprest
|
25,558,789,274
|
33,136,711,477
|
77,161,637,221
|
Unvouched Expenditure
|
553,142,715,946
|
77,014,932,341
|
74,793,881,735
|
Unaccounted for Stores
|
43,063,044,103
|
22,079,935,144
|
43,921,118,882
|
Irregular Payments
|
1,438,527,391
|
4,233,314,411
|
10,289,923,002
|
Non Recovery of Advances and Loans
|
7,195,232,766
|
3,479,476,312
|
10,098,900,307
|
Failure to Follow Procurement Procedures
|
121,438,503,116
|
4,674,317,060
|
2,540,559,305
|
Undelivered Materials
|
1,232,210,506
|
2,104,187,120
|
646,210,800
|
Non Submission of Expenditure Returns
|
107,765,375,773
|
27,083,333,334
|
3,090,848,292
|
Wasteful Expenditure
|
1,195,270,249
|
2,609,341,457
|
7,362,829,990
|
Overpayments
|
206,913,870
|
6,000,000
|
131,561,606
|
Misappropriation of Funds
|
463,631,579
|
1,060,362,947
|
1,096,257,658
|
Source: Auditor
General’s Report 2012

These issues arise as a result of the failure to adhere to
regulations and weaknesses in the implementation of internal control systems.
Revenue
Description
|
Actual Revenue
|
Income Tax (Other than mineral tax)
|
11,732,388,509,836
|
Medical Levy
|
24,487,279,427
|
Customs and Excise
|
3,680,555,710,400
|
Fuel Levy
|
613,804,508,639
|
Value Added Tax
|
4,721,273,708,622
|
Fines
|
19,744,120,468
|
Licences
|
297,789,051,570
|
Commissions
|
14,088,818,148
|
Fees of court or Office
|
278,780,165,970
|
Interest
|
549,400
|
Other Revenue
|
528,466,002,589
|
General Budget Support
|
536,346,731,135
|
Sector Budget Support
|
65,741,036,200
|
Total
|
22,513,466,192,404
|
Source: Auditor
General’s Report 2012

Excess Expenditure
A review of Statement ‘C’ of the Financial Report for the year
under review revealed that expenditure in excess of the provision voted by
Parliament in respect of three (3) heads of expenditure amounted to
K9,495,894,076 as tabulated below.
Ministry
|
Total Authorized
Provision
|
Actual
Expenditure
|
Excess
Expenditure
|
Ministry of Chiefs and Traditional
Affairs
|
77,130,791,355
|
77,806,017,300
|
675,225,945
|
Drug Enforcement Commission
|
41,863,422,400
|
50,683,890,531
|
8,820,468,131
|
Zambia Intelligence Service
|
321,444,299,489
|
321,444,499,489
|
200,000
|
Total
|
440,438,513,244
|
449,934,407,320
|
9,495,894,076
|
Source: Auditor
General’s Report 2012
This excess expenditure
of K 9,495,894,076 will require approval by Parliament as provided for in
Article 117 (5) of the Constitution.

Tax
During the financial year ended 31st December 2012, a total
amount of K20,772 billion was collected as tax and non-tax revenue against a
total target of K20,154 billion resulting in a surplus of K617 billion.
License Fees
In the Estimates of Revenue and Expenditure for the
financial year ended 31st December 2012 amounts totaling K26,094,573,819 were collected
resulting in an over collection of K3,637,160,669 as shown in the table below.
Revenue Type
|
Actual Collection
|
Mining licence
|
4,001,146,939
|
Surface Fees
|
553,719,733
|
Other Revenue
|
247,685,191
|
Water Board Fees
|
5,216,704,677
|
ERB Licence Fees
|
16,075,317,278
|
Total
|
26,094,573,819
|
Source: Auditor
General’s Report

Ministry of Defense
In the Estimates of Revenue and Expenditure for the
financial year ended 31st December 2012, a total provision of K788,358,396,083
was made to cater for various activities under the Zambia Army against which
amounts totaling K855,724,713,699 were released resulting in an over funding of
K67,366,317,616 which was not supported by a supplementary provision.
Ministry of Education
In the Estimates of Revenue and Expenditure for the
financial year ended 31st December 2011 and the period ended 30th September
2012, a total provision of K405,321,502,209 (US$84,602,207) was made to cater
for activities under the National Implementation Framework (NIF) II against
which amounts totaling K353,692,560,418 (US$69,852,938) were released resulting
in an underfunding of K51,628,941,791 (US$14,749,269) by various Cooperating
Partners (CPs) and GRZ.
Ministry of Lands, Energy and Water
In the Estimates of Revenue and Expenditure for the
Financial Year ended 31st December 2012, a total provision of K758,638,214,819
was made to cater for various activities under the Ministry.
During the period under review, the Ministry was split into
the Ministry of Mines, Energy and Water and the Ministry of Lands, Natural
Resources and Environmental Protection. The Ministry of Energy and Water after
the split and for which a total provision of K665,447,498,564 was made and
K187,823,389,111 released. The Ministry of Lands Natural Resources and Natural
Protection after the split and for which a total provision of K109,424,660,361
was made and K69,404,903,943 released
In the Estimates of Revenue and Expenditure for the
Financial Year ended 31st December 2012, a provision of K28,493,771,000 was
made to cater for opening up of new areas for development. in various local
authorities against which amounts totalling K25,839,421,228 were released resulting
in an underfunding of K2,654,349,772.
Ministry of Agriculture and Cooperatives
In the Estimates of Revenue and Expenditure for the financial
year ended 31st December 2012, a provision of K1,156,181,000,744 was made to
cater for the purchase and distribution of inputs under the Farmer Input
Support Programme (FISP) against which K1,155,861,071,547 was released
resulting in an under funding of K319,929,197. As at 31st December 2012, a
total amount of K1,139,624,512,924 had been spent leaving a balance of
K16,236,558,623.
In the Estimates of Revenue and Expenditure for the
financial year ended 31st December, 2012, a provision of K96,440,628,594 was
made to cater for various activities at the DACOs and PACOs against which
amounts totalling K100,138,048,659 were released.
Constitutional and Statutory Expenditure – Ministry of Finance
Head 99 comprises funds for servicing external and internal
debt, contingency and other expenditure and is controlled by the Secretary to
the Treasury at the Ministry of Finance.
Management Information System
The Ministry of Finance (MOF) has been using the United Nations
Conference on Trade and Development‟s (UNCTAD) Debt Management and Financial
Analysis System (DMFAS) since 1986. This is a specialised debt management and
financial analysis software designed to help countries manage external and
domestic public debt, including securities. The Investment and Debt Management
(IDM) Department is charged with the core function of management of public
debt, supervision and monitoring of Government investments. IDM has five units;
External Debt, Domestic Debt, Government Investments, Accounting and a Data
Debt Unit. The DMFAS database is maintained by the Debt Data Unit and contains
only public external debt. The other units of IDM have no access to the system.
In the Estimates of Revenue and Expenditure for the financial year ended 31st
December 2012, a total provision of K3,934,159,822,511 was made to cater for
various activities against which a total amount of K3,102,063,287,369 was
released resulting in an under funding of K832,096,535,142.
The Ministry of Finance did not provide reports clearly
showing the debt stock for Pre HIPC and Post HIPC position of the Country.
Position of Public Debt
The position of domestic and external debt as at 31st December
2012 was as shown in the table below:
TYPE
|
Opening Balance as at 1st
January 2012
|
Amount Borrowed
During the
year 2012
|
Amount Repaid
During the
year 2012
|
Closing Balance as at 31st
December 2012
|
Domestic Debt
|
13,825,383,063,019
|
11,241,865,743,600
|
9,710,182,629,280
|
15,357,066,177,338
|
External Debt
|
7,656,868,272,984
|
8,927,980,854,463
|
1,153,182,535,027
|
15,431,666,592,420
|
Total
|
21,482,311,336,003
|
20,169,846,598,063
|
10,863,365,164,308
|
30,788,792,769,758
|
Source: Auditors
General Report

As can be seen from the table above, total public debt increased
from K21,482,311,336,003 as at 31st December 2011 to K30,788,792,769,758 as at
31st December 2012 representing an increase of 43%. The increase in the debt
levels was attributed to new borrowings made in 2012.
Loans
Records in respect of loans in amounts totalling US$123,446,502
as shown in the table below, revealed that the Government has not been
consistent in servicing the loans from Brazil, Iraq and China. Loans from
Brazil were last serviced in June 2001, from Iraq in July 1984 and those from China
have never been serviced and interest has since accumulated to US$44,906,325 as
shown in the table below.
CREDITOR NAME
|
ARREARS
PRINCIPAL
US$
|
ARREARS
INTEREST
US$
|
OUTSTANDING INCL
ARREARS TOTAL
US$
|
BANCO DE BRASIL
|
32,250,842.36
|
34,886,132.57
|
67,136,974.93
|
GOVT OF CHINA
|
19,221,513
|
19,221,512.84
|
|
GOVT OF IRAQ
|
27,067,822
|
10,020,192.43
|
37,088,014.28
|
Total
|
78,540,177
|
44,906,325
|
123,446,502.05
|
Source: Auditor
General’s Report


Debt owed to Brazil
The Government of Zambia and the Federal Government of Brazil have agreed that the outstanding debt of US $67. 1 million owed to Brazil will be treated through the special bilateral arrangement. Under this arrangement, 80 percent will be cancelled while 20 percent will be repaid on terms of the agreement to be signed between the two parties. The debt relief agreement between Zambia and Brazil is expected to be signed in December 2014.
Debt owed to Iraq
The Government of Zambia and the Government of Iraq have agreed to settle the outstanding debt of $37 million under the Paris Club VIII debt write-off framework. Under this arrangement, Iraq will cancel 90 percent of the outstanding debt stock, while the remaining 10 percent will be repaid on terms of the agreement to be signed between the two parties.
Debt owed to China
In 2011, the Government of China, through a protocol, delivered partial debt relief by cancelling the outstanding amounting of RMB Yuan 247 million which represented 50 percent of the debt forgiveness from China. The Government of Zambia has commenced negotiations with Government of China on the cancellation of the remaining 50 percent of the outstanding debt. It is expected that the negotiations will be completed by the end of this year and a debt relief agreement signed in 2015. Total outstanding debt to China stood at US $19. 2 million as at end of 2012.
Conclusion
Looking back to the end of 2013, preliminary estimates indicate that the total debt as a percentage of GDP stood at 28%. Of this, external debt stood at US $3.1 billion [approximately K17 billion] or 13.7% of GDP, whilst domestic debt stood at K17.6 billion or approximately 14% of GDP. Debt service (principal and interest payments) stood at K11 billion or 1.2% of GDP (and approximately 6% of domestic revenue). In this regard, external and domestic debt levels are below the international thresholds of 40% and 25%, respectively.
The Debt situation has deteriorated, but is still inline with 2030 vision goals. This does not mean that our current scenario should be promoted.The overall sentiment in the Auditor General's report is riddled with lack of Internal controls, with the other biggest problems in 2012 being Non Submission of Expenditure Returns, Failure to Follow Procurement Procedures,Irregular payments
and Unvouched expendititure.


 Posts
Posts

